Visual Studio IDE
 Visual Studio for Mac
 Visual Studio Code
Game development with Visual Studio
Write and debug your games with Visual Studio

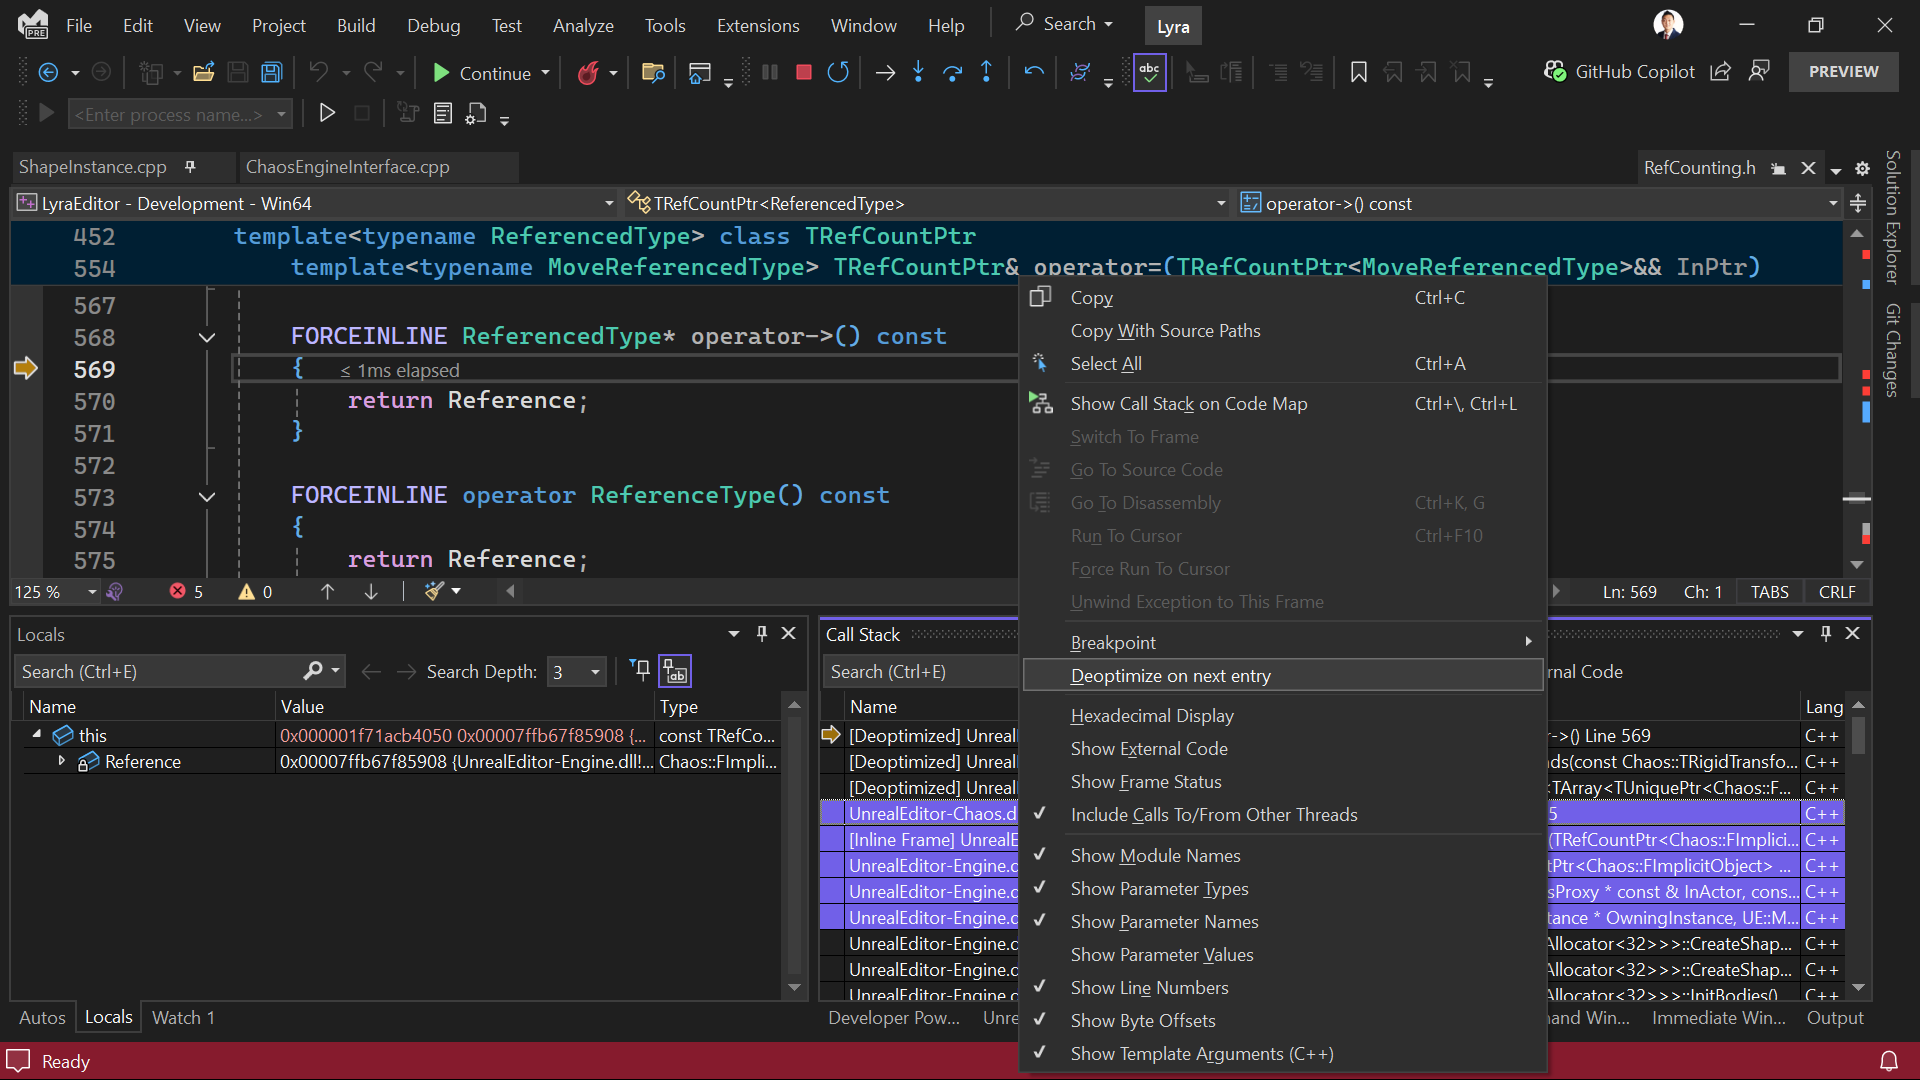
Full Debuggability for Optimized Builds
C++ Dynamic Debugging dynamically deoptimizes code that you set breakpoints on or step into, giving you the performance of optimized code with the debugging experience of unoptimized code.
Unlock Familiar Debugging Actions
C++ Dynamic Debugging unlocks familiar debugging patterns for optimized code without compromising on performance. You can reliably step through code, view local variables, set conditional breakpoints, and set the next statement without impacting frame rates.
Fully Supported for AAA Game Development
C++ Dynamic Debugging is supported by your favorite middleware vendors. Experience native support when working with IncrediBuild, FastBuild, Unreal Engine, and Xbox GDK. See our documentation for details.
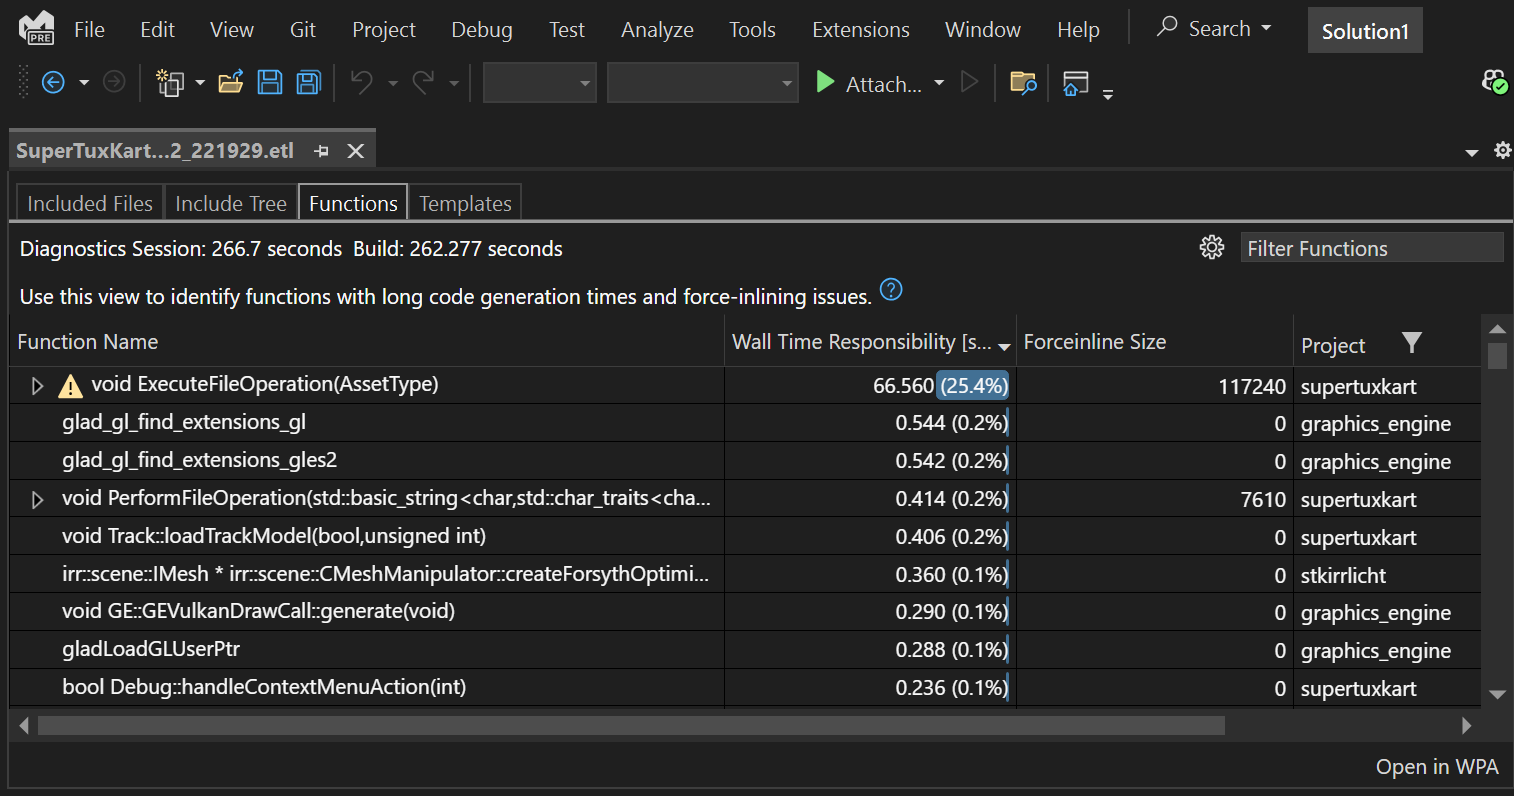
Detailed Diagnostics for C++ Code
Build Insights leverages MSVC’s trace capture technology to provide detailed performance reports that help you identify bottlenecks in your build process. Receive in-depth reports on costly #includes, lengthy function generation, and expensive template instantiations.
Fully Integrated with Visual Studio
Capture your trace and view your report without leaving Visual Studio. Navigate to problematic code directly from within the reports.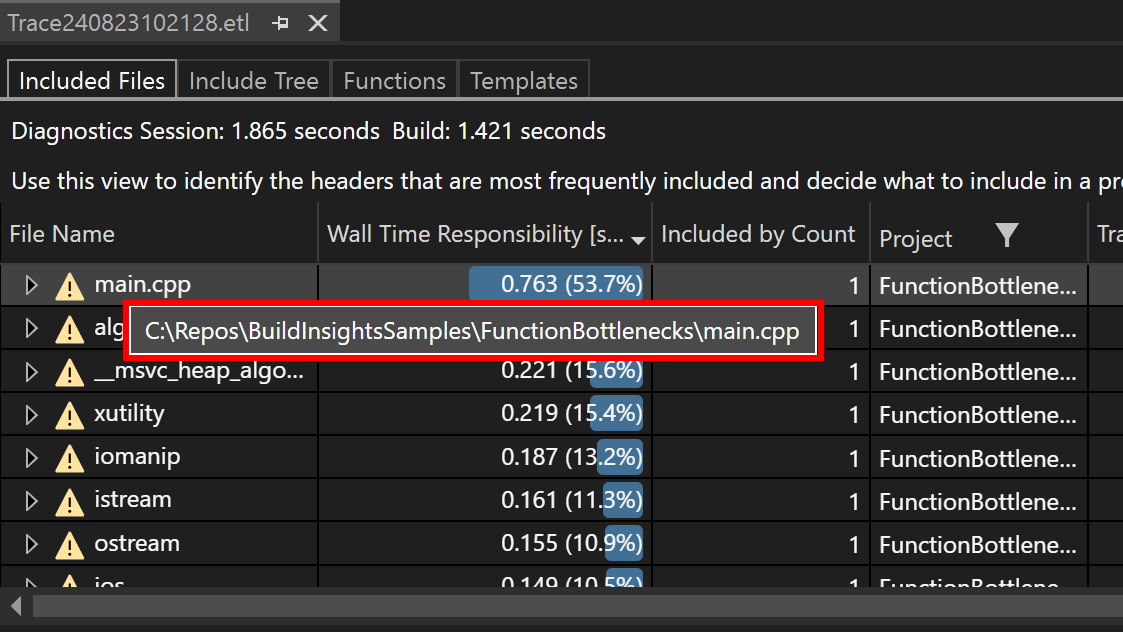

Proven Success in AAA Game Development
Activision used Build Insights to reduce Call of Duty: Modern Warfare II’s build time by 50%. See how Build Insights was successfully leveraged in our detailed case study.The Unity engine integrates into one unparalleled platform to create 2D and 3D games and interactive content. Create once and publish to 21 platforms, including all mobile platforms, WebGL, Mac, PC, and Linux desktop, web, or consoles. Use powerful cross-platform tools to make your interactive content run beautifully on any device.
Debug in Visual Studio
World-class debugging for Unity games in Visual Studio
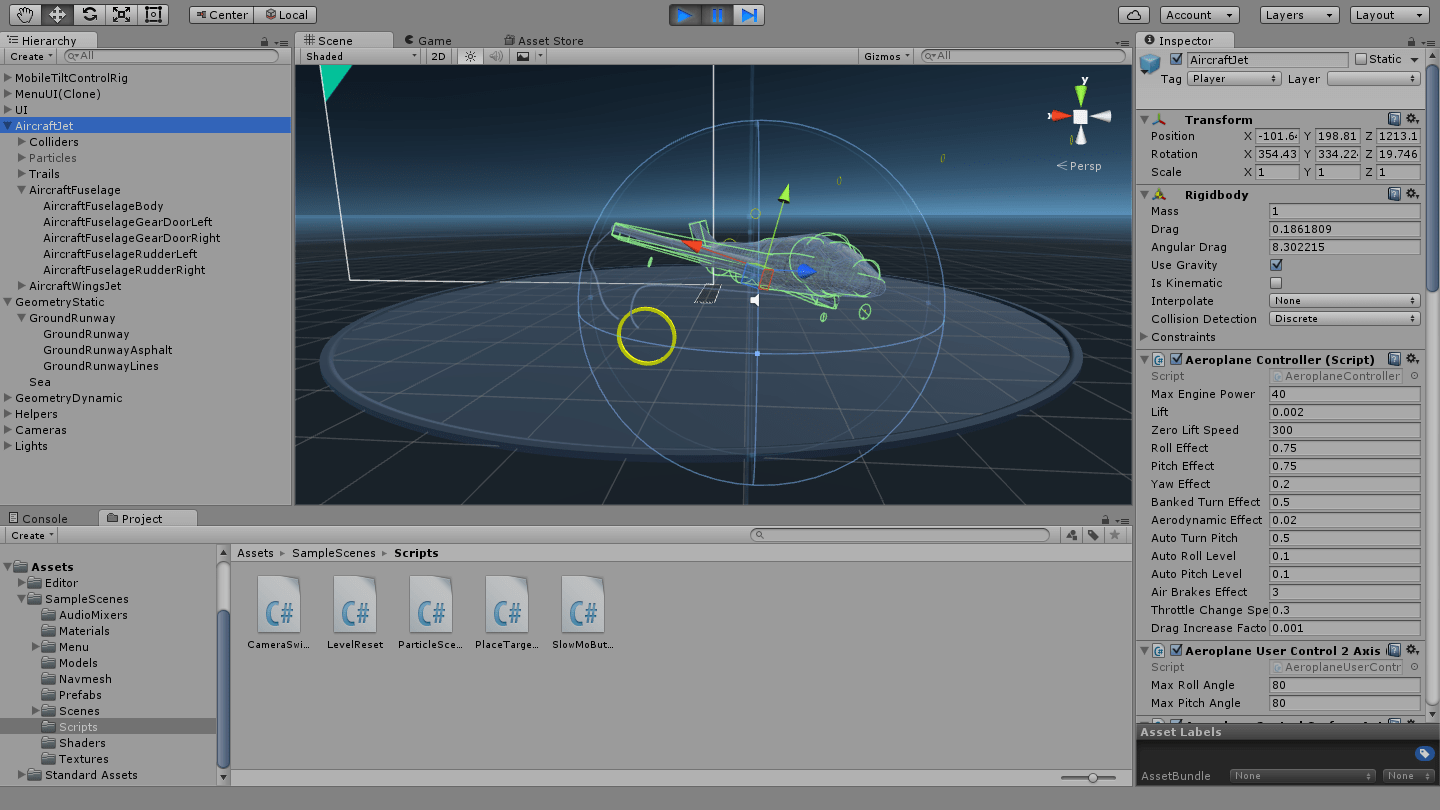
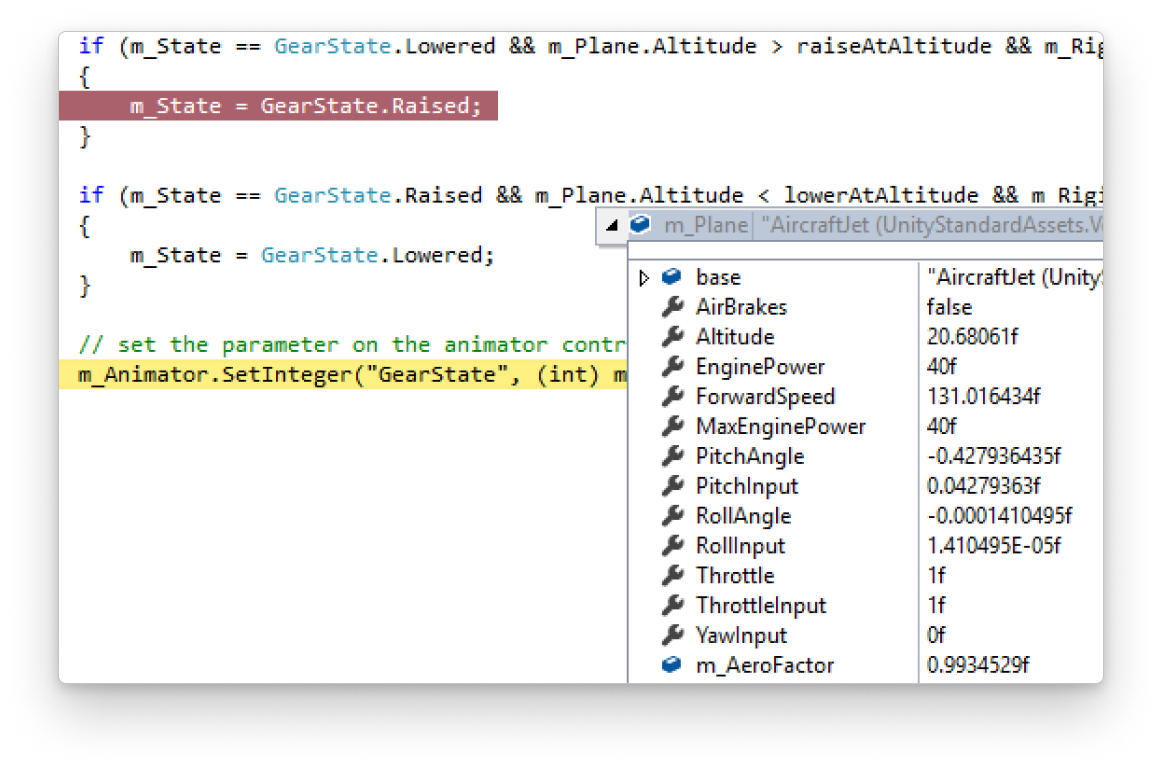
Visual Studio brings a premium debugging experience to the Unity game engine. Identify issues quickly by debugging your Unity games in Visual Studio—set breakpoints and evaluate variables and complex expressions. You can debug your Unity game that is running either in the Unity Editor or in the Unity Player, or even debug an external managed DLL in your Unity Project.
Enhance productivity
Full featured IDE for Unity
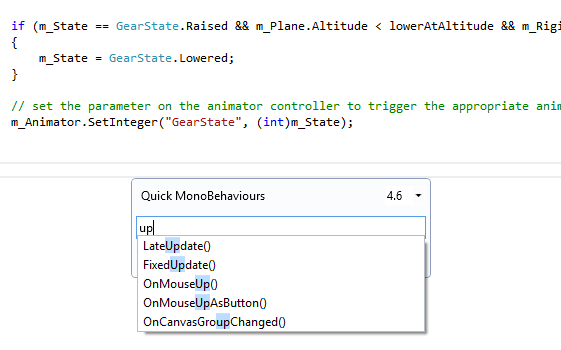
Write code more productively by leveraging all the productivity features that Visual Studio has to offer, such as IntelliSense, refactoring, and code browsing capabilities. Customize the coding environment exactly the way you want–choose your favorite theme, color, fonts, and all the other settings. In addition, use the Unity Project Explorer to navigate and create your Unity scripts–no more switching back and forth between multiple IDEs. Create Unity script methods inside Visual Studio quickly by using the Implement MonoBehaviours and the Quick MonoBehaviours Wizards.
Unreal Engine is an advanced game engine that provides a complete set of tools and technologies for crafting highly realistic and immersive interactive experiences. Enhance your productivity by editing, building, and debugging your Unreal Engine projects with Visual Studio’s seamless integration.
Code with Visual Studio
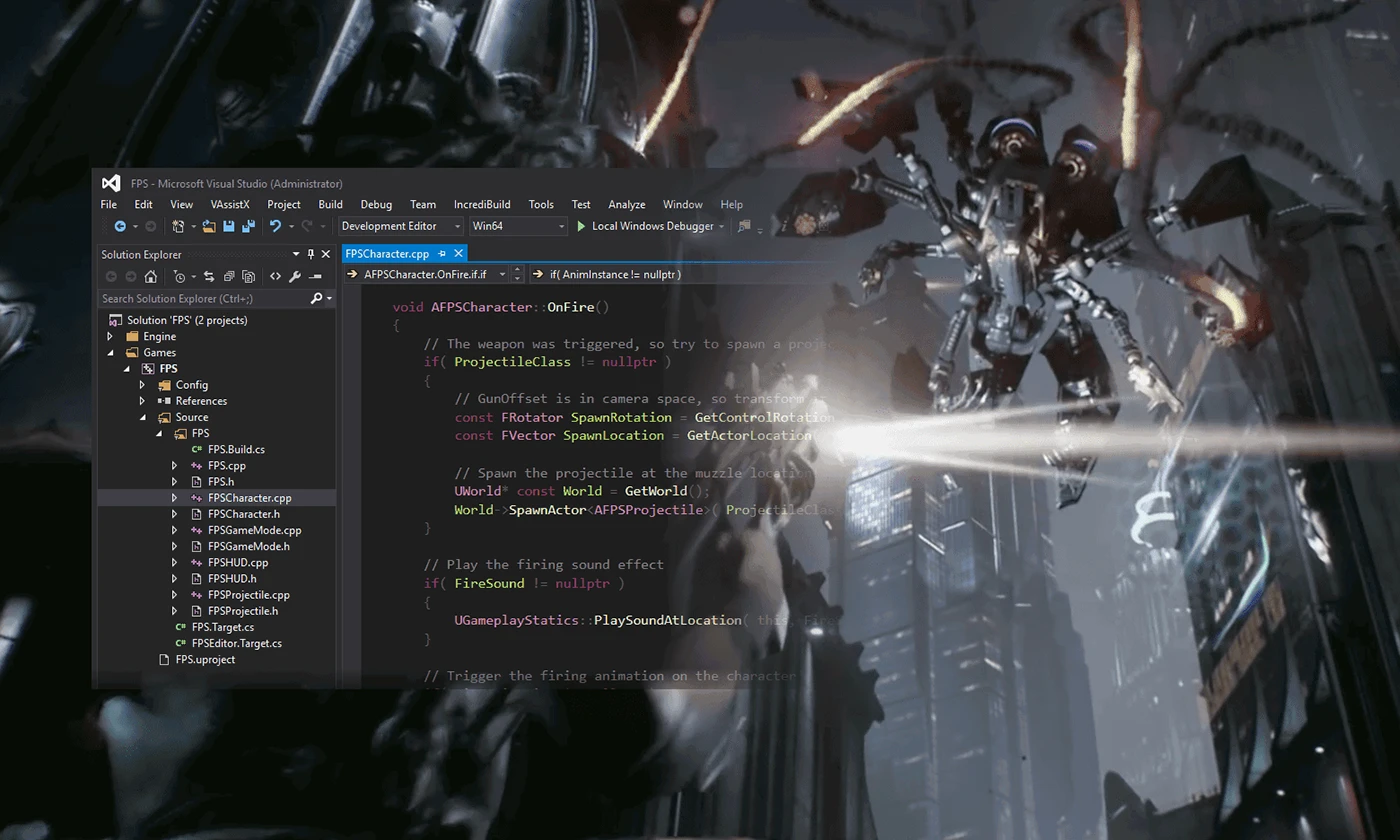
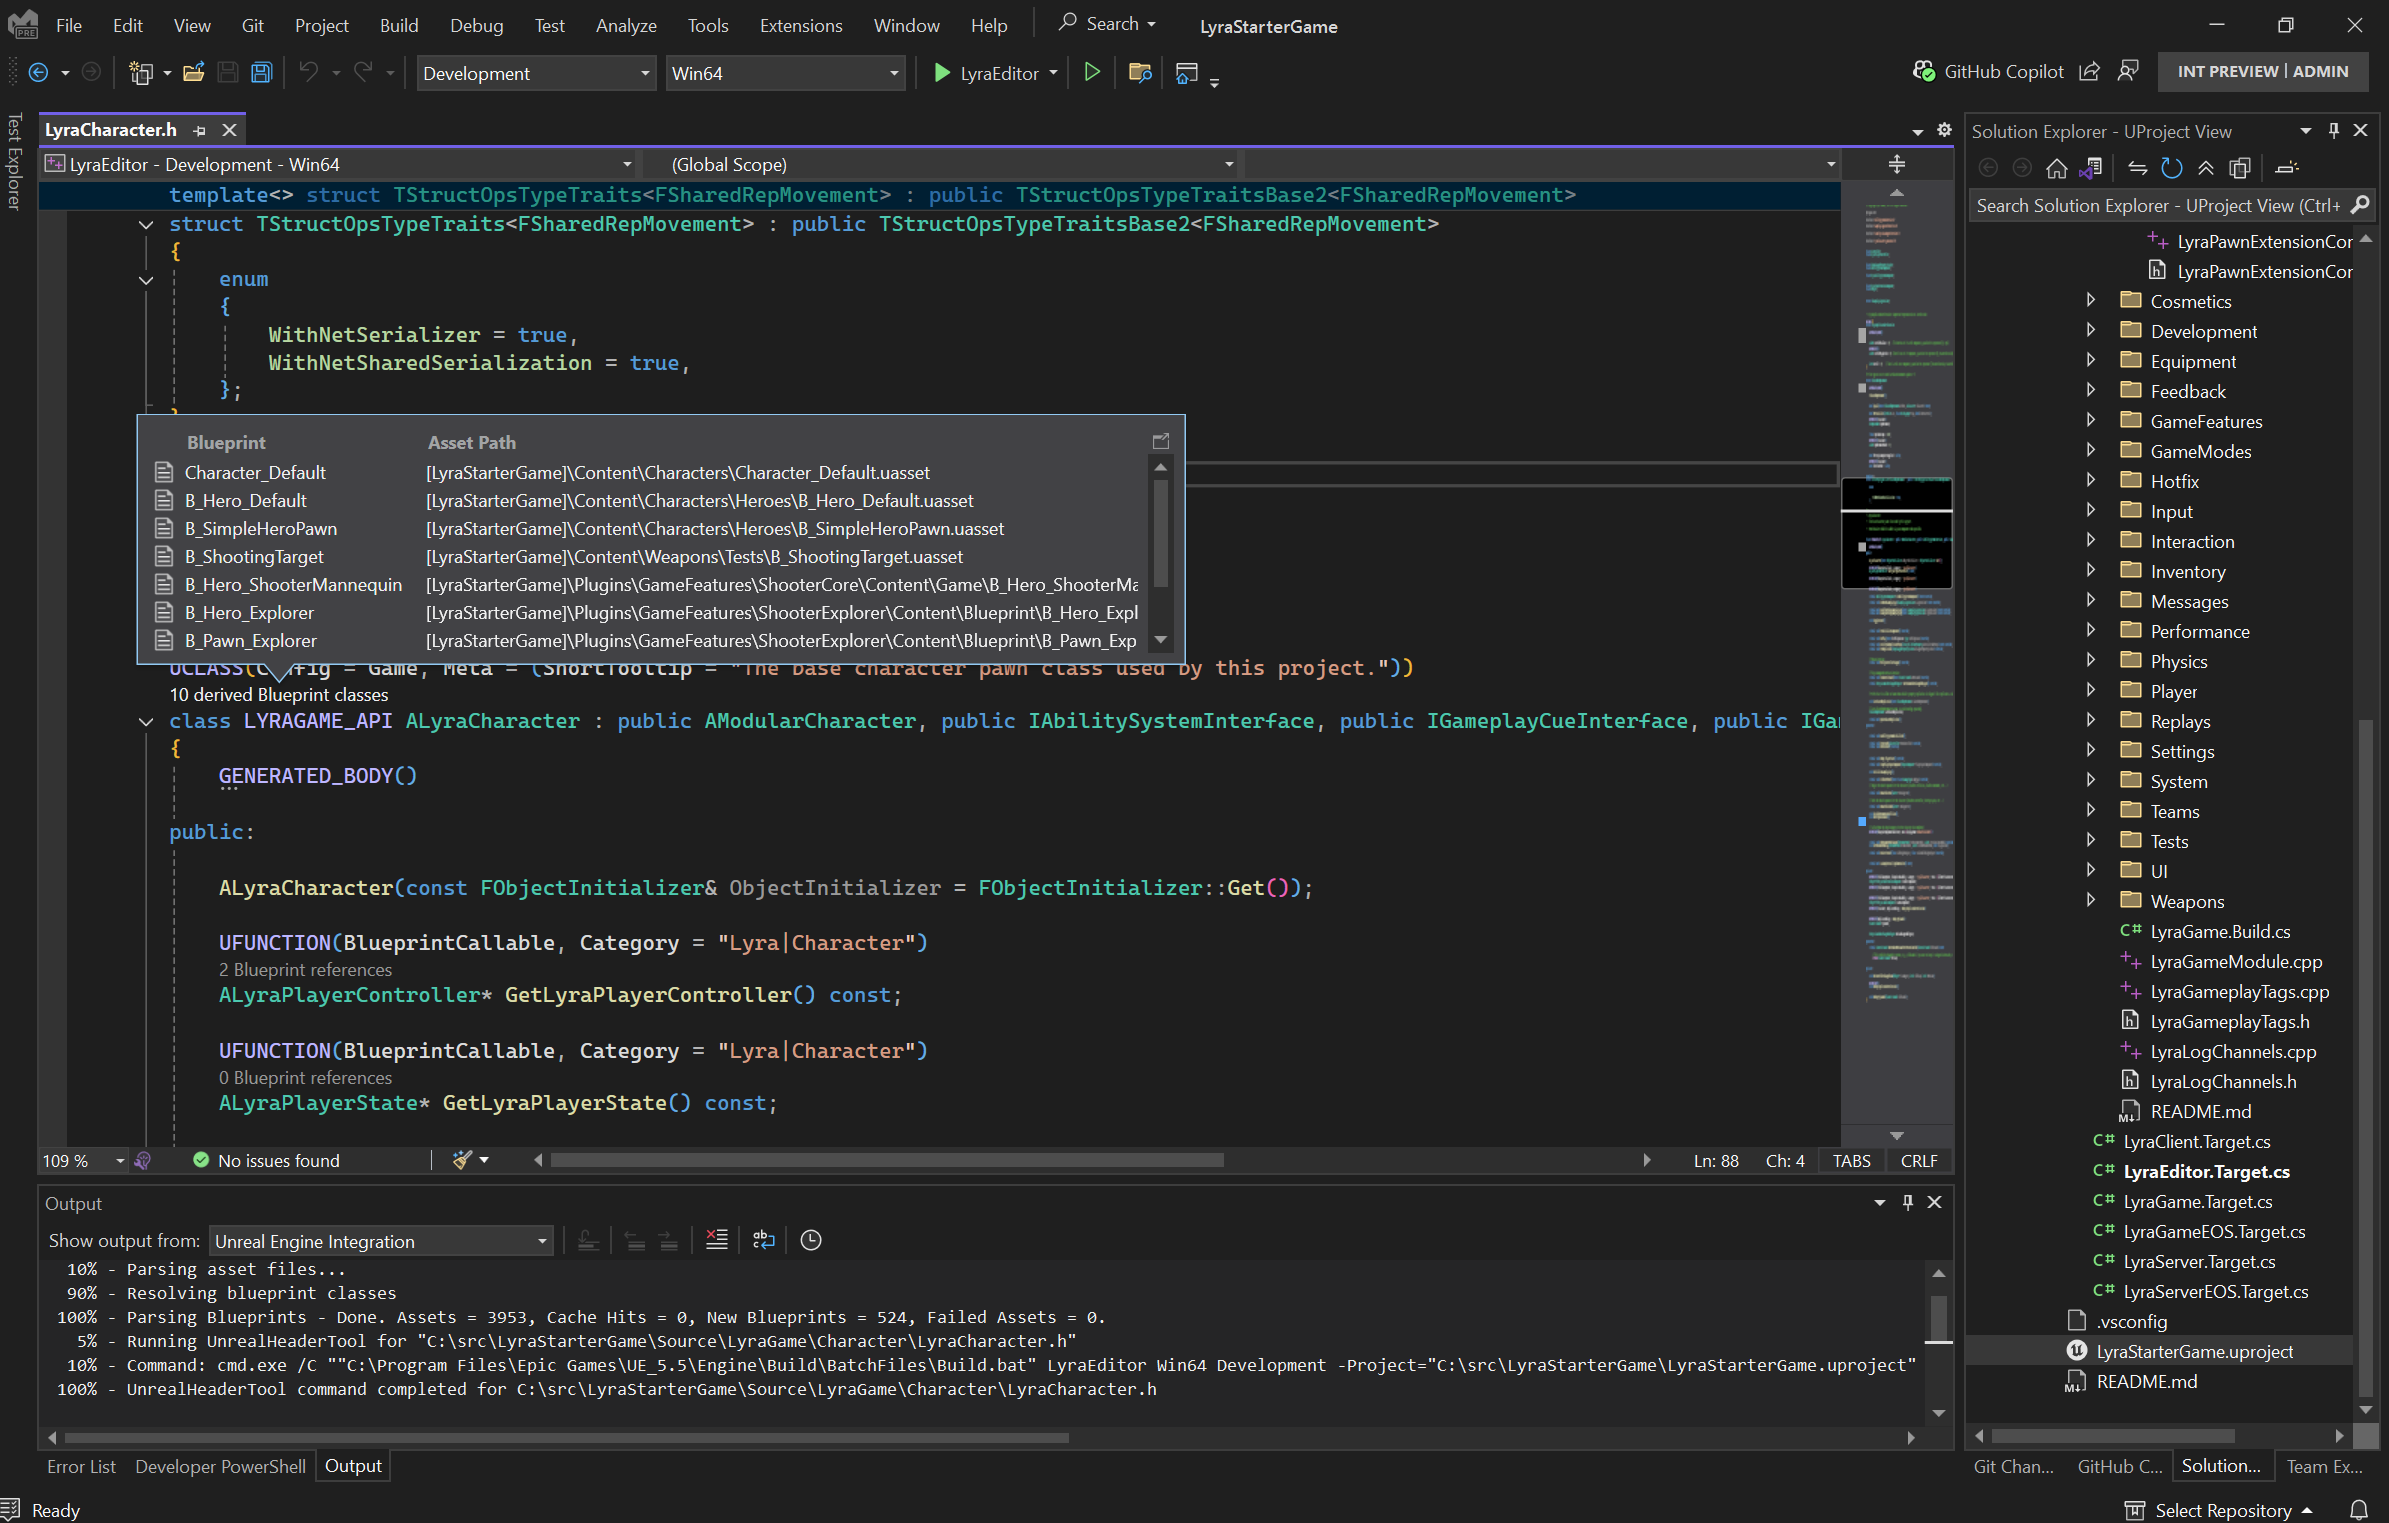
Unreal Engine is designed to integrate smoothly with Visual Studio, allowing you to make code changes quickly and easily in your projects to immediately see results upon compilation. Write code with powerful IntelliSense support, including suggestions for Unreal Engine types and reflection specifiers. See Blueprint references inline without needing to switch to the UE editor.
With the new .uproject support, seamlessly switch between Visual Studio and the Unreal Engine editor. All your changes will be automatically synced without needing to regenerate your solution along with a boost to IntelliSense speed and reliability.
Debug with Visual Studio
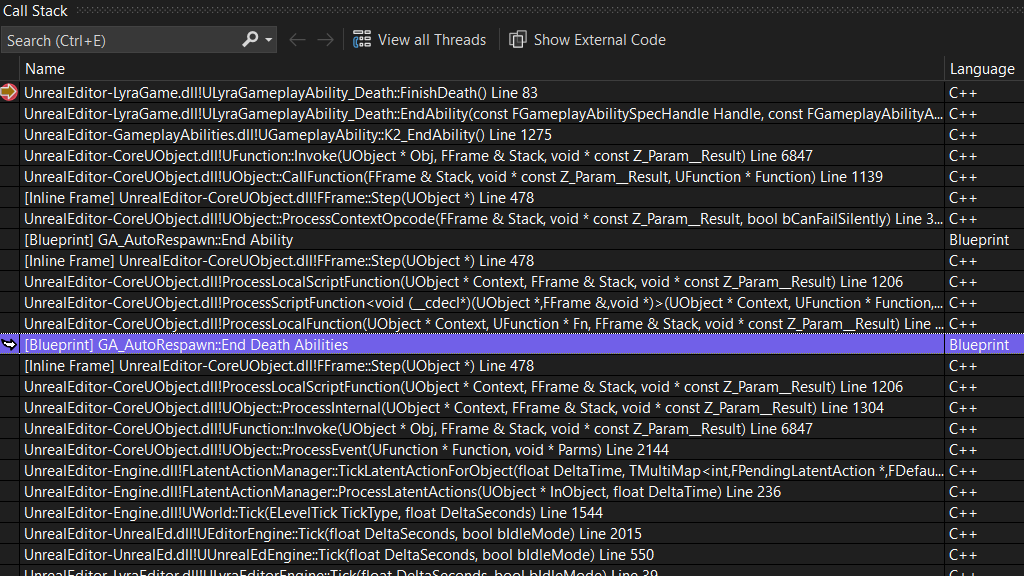
Visual Studio offers world-class debugging experience for Unreal Engine. Debug your Unreal projects easily by leveraging extended support with visualizers in the debugger that allows easy inspection of common Unreal types. Debug your release builds with C++ Dynamic Debugging without losing out on performance.The integrated Blueprints Debugger streamlines game development by identifying which Blueprints are utilizing specific C++ code, allowing you to nativize Blueprints and convert nodes to C++ classes iteratively.
Build high-performance 2D and 3D games in DirectX to run on a variety of devices in the Windows family, including desktops, tablets, and phones. Visual Studio offers a great set of tools for developing DirectX games, from writing shader code and designing assets, to debugging and profiling graphics—all in the same familiar Visual Studio IDE.

Project templates
Get started quickly
Get started building DirectX games in Visual Studio by using the built-in DirectX project templates. Whether you’re building a DirectX 12 or DirectX 11 game for Windows or Windows Phone, you’ll find a template that suits you.

Debug Graphics
Capture frames local or remote
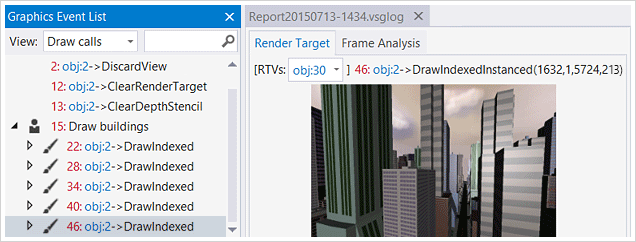
Rendering problems can be tricky to troubleshoot. Visual Studio Graphics Diagnostics together with the PIX on Windows standalone tool provides an easy way to capture and analyze frames from your DirectX 10, 11 or 12 games locally or remotely. You can inspect each DirectX event, graphics object, pixel history, and look into the graphics pipeline to understand exactly what occurred during the frame. This tool also captures call stacks for each graphics event, making it easy to navigate back to your application code in Visual Studio.
Debug shader code
The same world-class debugger now works for your shader code
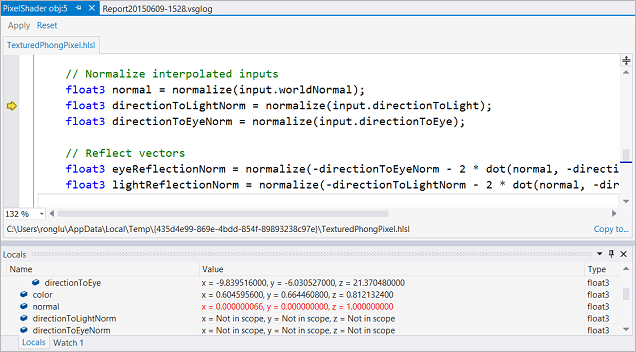
Debugging shader code from a captured frame is another great way to pinpoint the source of rendering problems. Simply set a breakpoint in your shader code and press F5 to debug it. You can inspect variables and expressions in Locals and Autos. If you’ve used the Visual Studio debugger for other languages before, you’ll find yourself right at home
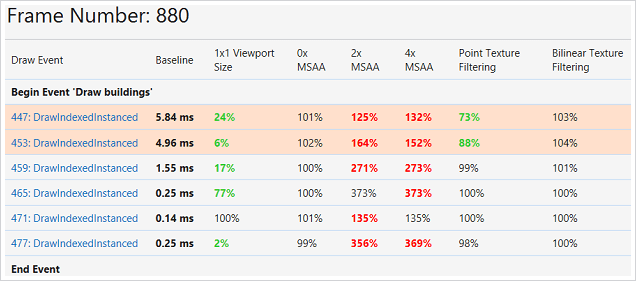
Increase frame rate
Find expensive draw calls
Looking for ways to increase the frame rate for your game? Visual Studio Frame Analysis can come in handy. It analyzes captured frames to look for expensive draw calls and performs experiments on them to explore performance optimization opportunities – all in a nice report.
Analyze GPU usage
Understand how your game is performing on the CPU and the GPU
Use Visual Studio GPU Usage or PIX on Windows to understand how your game performs on the CPU and the GPU. GPU Usage collects data in real time and complements Frame Analysis, which is performed on captured frames in an offline fashion. The GPU Usage report will clearly show where the bottleneck is, whether it’s on the CPU or the GPU.

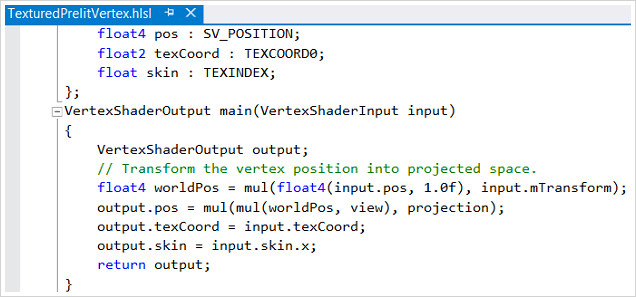
Shader syntax colorization
Whether your shader code is in HLSL files or FX files, the Visual Studio shader editor recognizes them. The shader editor provides syntax highlighting and braces auto-completion, making it easy to read and write shader code in Visual Studio. You can also configure the editor to use your favorite fonts and theme.
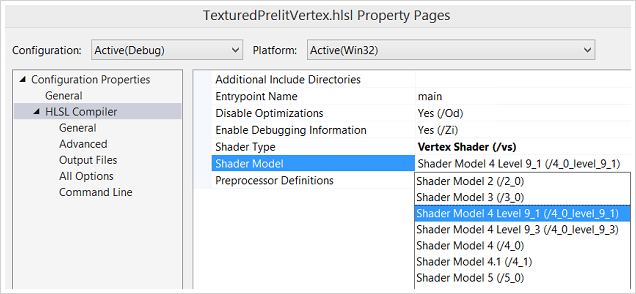
Shader files are part of your project
Just like they should be, shader files can be managed and built as part of your Visual Studio projects. Simply set the shader file properties to specify the shader type, shader model, and optimization settings you want. Visual Studio takes care of shader compilation for you.
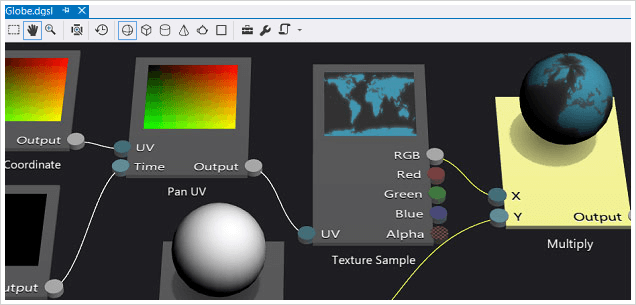
Design pixel shaders in Visual Studio Shader Designer
If you don’t know HLSL or prefer a more visual way to create shaders, the Visual Studio Shader designer has you covered. Instead of writing shader code in an editor, you add and connect shader nodes using a graphical interface. You can apply different textures, lights, and even add and view animations in real time. Making shaders has never been easier.
View 3D models
…in Visual Studio Model Viewer
No need to leave the IDE you’re already working in just to view the latest 3D model that your artist sent you. You can view OBJ, FBX 3D models inside Visual Studio. Pan, zoom, change camera positions, view the objects with time-based animations – there’s so much to explore in the 3D world. You can also make simple edits to the models in the Model Viewer.

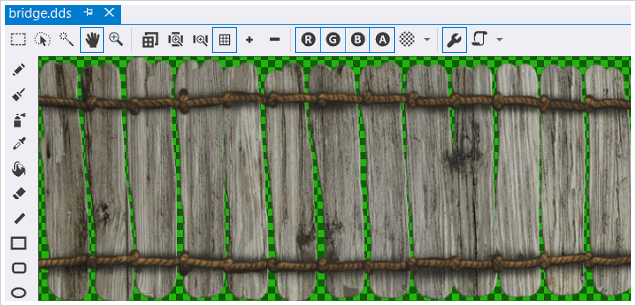
Edit textures
…in Visual Studio Image Editor
The Visual Studio Image Editor not only works great with image files, but also understands DirectDraw Surface (DDS) texture files. Besides the basic viewing and drawing functionality, you can also toggle RGBA channels, generate mip-maps, and apply filters. This image editor is capable of accomplishing many texture editing tasks.
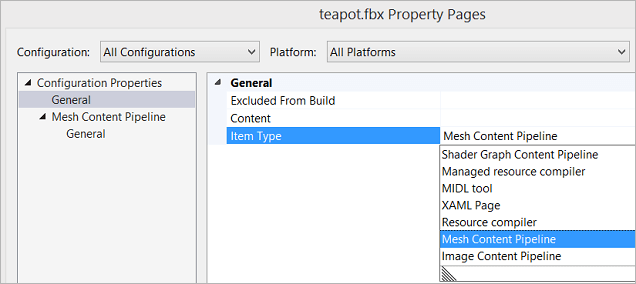
Asset content pipeline
Manage content pipelines
Dealing with assets in various formats can be overwhelming. Visual Studio provides content pipeline management for images, models, and shaders. Simply set the file properties to use the content pipeline and configure the settings. Visual Studio will perform the format conversions for you at build time.